Kaggle房价预测实践系列2-特征工程
上篇文章中,我们对拿到的数据做了深入的EDA。现在,根据EDA的结论,我们可以正式的实施特征工程的工作了。特征工程需要做的工作内容大致包括以下的内容:
- 删除极端值
- 分离训练特征和标签属性
- 管道处理
- 合并训练特征和测试特征
- 缺失值处理
- 填充缺失值
- 字符型特征的处理
- 歪斜正态分布矫正
下面,就通过实际的代码来展示以上的处理过程:
- 删除极端值
通过前面EDA的分析,我们看到 OverallQual 属性中, 小于5的设置值通常对应低的 SalePrice ,因此,当出现小于5的设置值却对应大的 SalePrice 时,我们就当作此为一种极端值,不计入我们的训练特征中,因此选择将其删除。同理,相同的逻辑我们也应用到其他的特征中去,比如 GrLivArea。
train.drop(train[(train['OverallQual']<5) & (train['SalePrice']>200000)].index, inplace=True) train.drop(train[(train['GrLivArea']>4500) & (train['SalePrice']<300000)].index, inplace=True) train.reset_index(drop=True, inplace=True) - 将训练特征和标签属性分离
train_labels = train['SalePrice'].reset_index(drop=True) train_features = train.drop(['SalePrice'], axis=1) test_features = test - 管道处理
-
- 合并训练特征与测试特征
all_features = pd.concat([train_features, test_features]).reset_index(drop=True)
all_features.shape
(2917, 80)
- 合并训练特征与测试特征
-
- 缺失值处理 在对缺失值的处理过程中,需要经历以下几个步骤:
-
- 对缺失值的情况做初步的统计
 def percent_missing(df):
     data = pd.DataFrame(df)
     df_cols = list(pd.DataFrame(data))
     dict_x = {}
     for i in range(0, len(df_cols)):
         dict_x.update({df_cols[i]: round(data[df_cols[i]].isnull().mean()*100,2)})

     return dict_x

 missing = percent_missing(all_features)
 df_miss = sorted(missing.items(), key=lambda x: x[1], reverse=True)
 print('Percent of missing data')
 df_miss[0:10]
Percent of missing data Out[17]: [('PoolQC', 99.69), ('MiscFeature', 96.4), ('Alley', 93.21), ('Fence', 80.43), ('FireplaceQu', 48.68), ('LotFrontage', 16.66), ('GarageQual', 5.45), ('GarageFinish', 5.45), ('GarageYrBlt', 5.45), ('GarageCond', 5.45)]-
- 将缺失的情况通过可视化的形式表现出来
 sns.set_style("white")
 f, ax = plt.subplots(figsize=(8, 7))
 sns.set_color_codes(palette='deep')
 missing = round(train.isnull().mean()*100,2)
 missing = missing[missing > 0]
 missing.sort_values(inplace=True)
 missing.plot.bar(color="b")
 # Tweak the visual presentation
 ax.xaxis.grid(False)
 ax.set(ylabel="Percent of missing values")
 ax.set(xlabel="Features")
 ax.set(title="Percent missing data by feature")
 sns.despine(trim=True, left=True)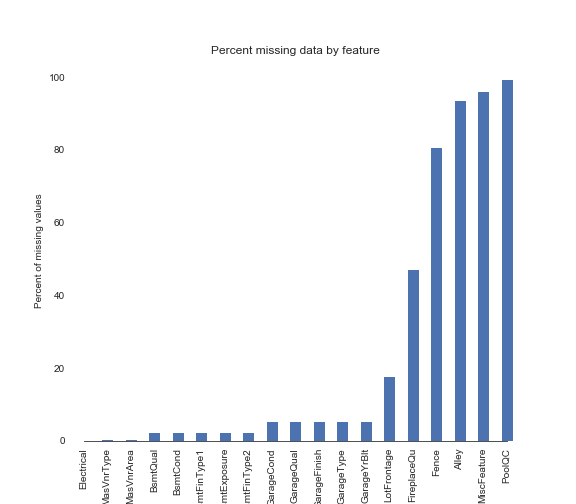
-
- 在对缺失值的情况有了一定的掌握之后,针对缺失值的实际情况制定处理策略。这里,需要有两种处理情况。一种是对非数值型的预测变量转回字符类型;另一种,是对缺失值直接操作。
- 非数值型的预测变量转回字符类型
all_features['MSSubClass'] = all_features['MSSubClass'].apply(str) all_features['YrSold'] = all_features['YrSold'].astype(str) all_features['MoSold'] = all_features['MoSold'].astype(str)- 缺失值操作处理, 主要使用 .findna()
  def handle_missing(features):
      # the data description states that NA refers to typical ('Typ') values
      features['Functional'] = features['Functional'].fillna('Typ')
      # Replace the missing values in each of the columns below with their mode
      features['Electrical'] = features['Electrical'].fillna("SBrkr")
      features['KitchenQual'] = features['KitchenQual'].fillna("TA")
      features['Exterior1st'] = features['Exterior1st'].fillna(features['Exterior1st'].mode()[0])
      features['Exterior2nd'] = features['Exterior2nd'].fillna(features['Exterior2nd'].mode()[0])
      features['SaleType'] = features['SaleType'].fillna(features['SaleType'].mode()[0])
      features['MSZoning'] = features.groupby('MSSubClass')['MSZoning'].transform(lambda x: x.fillna(x.mode()[0]))

      # the data description stats that NA refers to "No Pool"
      features["PoolQC"] = features["PoolQC"].fillna("None")
      # Replacing the missing values with 0, since no garage = no cars in garage
      for col in ('GarageYrBlt', 'GarageArea', 'GarageCars'):
          features[col] = features[col].fillna(0)
      # Replacing the missing values with None
      for col in ['GarageType', 'GarageFinish', 'GarageQual', 'GarageCond']:
          features[col] = features[col].fillna('None')
      # NaN values for these categorical basement features, means there's no basement
      for col in ('BsmtQual', 'BsmtCond', 'BsmtExposure', 'BsmtFinType1', 'BsmtFinType2'):
          features[col] = features[col].fillna('None')

      # Group the by neighborhoods, and fill in missing value by the median LotFrontage of the neighborhood
      features['LotFrontage'] = features.groupby('Neighborhood')['LotFrontage'].transform(lambda x: x.fillna(x.median()))

      # We have no particular intuition around how to fill in the rest of the categorical features
      # So we replace their missing values with None
      objects = []
      for i in features.columns:
          if features[i].dtype == object:
              objects.append(i)
      features.update(features[objects].fillna('None'))

      # And we do the same thing for numerical features, but this time with 0s
      numeric_dtypes = ['int16', 'int32', 'int64', 'float16', 'float32', 'float64']
      numeric = []
      for i in features.columns:
          if features[i].dtype in numeric_dtypes:
              numeric.append(i)
      features.update(features[numeric].fillna(0))
      return features

  all_features = handle_missing(all_features)
-
以上,完成了缺失值的处理之后,对总体数据再次检查:
missing = percent_missing(all_features)
df_miss = sorted(missing.items(), key=lambda x: x[1], reverse=True)
print('Percent of missing data')
df_miss[0:10]
Percent of missing data
Out[32]:
[('3SsnPorch', 0.0),
 ('MasVnrType', 0.0),
 ('ScreenPorch', 0.0),
 ('LotConfig', 0.0),
 ('BsmtUnfSF', 0.0),
 ('GarageQual', 0.0),
 ('Exterior1st', 0.0),
 ('GarageFinish', 0.0),
 ('2ndFlrSF', 0.0),
 ('HalfBath', 0.0)]
-
- 正态分布歪斜矫正
这里,需要对所有数值型训练特征进行歪斜矫正。因此,首先需要找出所有的数值型特征。
numeric_dtypes = ['int16', 'int32', 'int64', 'float16', 'float32', 'float64']
numeric = []
for i in all_features.columns:
    if all_features[i].dtype in numeric_dtypes:
        numeric.append(i)
下面,照例我们要对数据进行可视化展示,通过前面的步骤可以看出,可视化的过程虽然没有太大的难度,但是对于我们掌握数据的情况是非常有帮助的。
sns.set_style("white")
f, ax = plt.subplots(figsize=(8, 7))
ax.set_xscale("log")
ax = sns.boxplot(data=all_features[numeric] , orient="h", palette="Set1")
ax.xaxis.grid(False)
ax.set(ylabel="Feature names")
ax.set(xlabel="Numeric values")
ax.set(title="Numeric Distribution of Features")
sns.despine(trim=True, left=True)
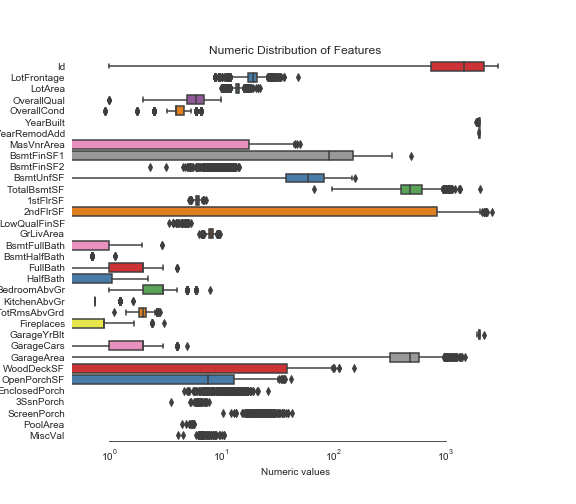
找出图中可以明显观察到歪斜的特征,进行矫正处理。
skew_features = all_features[numeric].apply(lambda x: skew(x)).sort_values(ascending=False)

high_skew = skew_features[skew_features > 0.5]
skew_index = high_skew.index

print("There are {} numerical features with Skew > 0.5 :".format(high_skew.shape[0]))
skewness = pd.DataFrame({'Skew' :high_skew})
skew_features.head(10)
There are 25 numerical features with Skew > 0.5 :
Out[35]:
MiscVal          21.939672
PoolArea         17.688664
LotArea          13.109495
LowQualFinSF     12.084539
3SsnPorch        11.372080
KitchenAbvGr      4.300550
BsmtFinSF2        4.144503
EnclosedPorch     4.002344
ScreenPorch       3.945101
BsmtHalfBath      3.929996
dtype: float64
接下来,是关键的标准化转换过程,使用的库来自scipy中的boxcox1p函数。
for i in skew_index:
    all_features[i] = boxcox1p(all_features[i], boxcox_normmax(all_features[i] + 1))
再一次,来看矫正之后的效果:
sns.set_style("white")
f, ax = plt.subplots(figsize=(8, 7))
ax.set_xscale("log")
ax = sns.boxplot(data=all_features[skew_index] , orient="h", palette="Set1")
ax.xaxis.grid(False)
ax.set(ylabel="Feature names")
ax.set(xlabel="Numeric values")
ax.set(title="Numeric Distribution of Features")
sns.despine(trim=True, left=True)
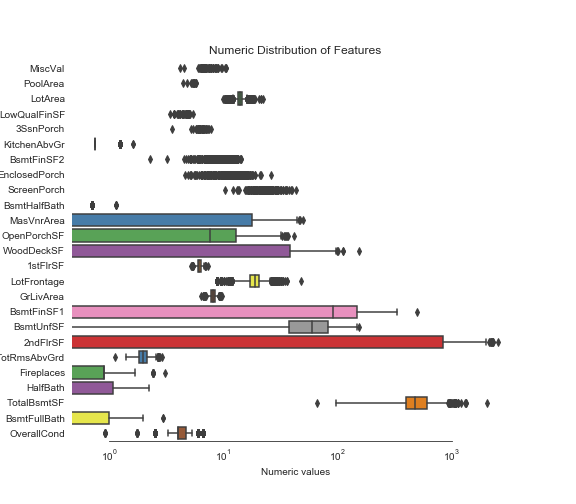
现在,我们得到的所有特征都变成了正态分布了。至此,所需要的特征工程也进行完毕。
PREVIOUSKaggle房价预测实践系列3-特征工程
NEXTElasticSearch 概览